
Access To Emergency Healthcare - Good Luck Getting Treatment in Many States!
Page 1 of 1

Access To Emergency Healthcare - Good Luck Getting Treatment in Many States!
![]() by Tue Oct 23, 2012 12:10 am
by Tue Oct 23, 2012 12:10 am
Access To Emergency Healthcare - Choose your states carefully!
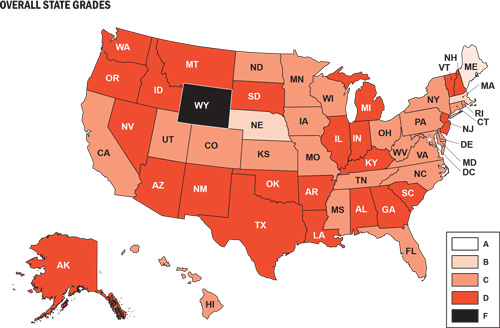
Overall Results: C-
The results of the 2009 Report Card present a picture of an emergency
care system fraught with significant challenges and under more stress
than ever before. The overall grade for the nation across all five categories is a C-. This low grade is particularly reflective of the poor score in Access to Emergency Care
(D-). Because of its direct impact on emergency services and capacity
for patient care, this category of indicators accounts for 30 percent of
the Report Card grade, so the poor score is especially relevant. This
category also incorporates many of the issues that states have
identified as their top areas of concern.24 These include:
The grades for the other categories are slightly better, but not strong enough to pull up the full national average. Both Disaster Preparedness and Quality and Patient Safety Environment receive a C+, Public Health and Injury Prevention receives a grade of C, and the Medical Liability Environment receives a grade of C-.
National Trends and State Comparisons by Category
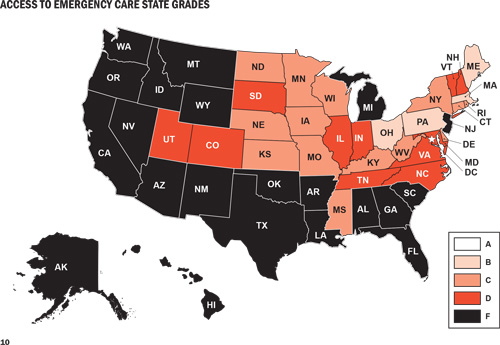
Access to Emergency Care
The national grade for Access to Emergency Care is a D-. As
noted earlier, the access category includes many of the issues that
states are struggling with the most. Unfortunately, there is a critical
lack of detailed and consistent state-specific data related to some of
these major access issues, such as boarding, ambulance diversion, and
on-call specialist shortages. Thus, though these issues are having a
serious impact on Access to Emergency Care across the country, it is virtually impossible to craft a meaningful state-by-state comparison of these indicators.
In a 2006 report, nearly three-quarters (73 percent) of emergency
department medical directors surveyed the previous year reported
inadequate on-call specialist coverage, compared with two-thirds in
2004. The problem was most pervasive in the southern United States, with
81 percent stating that on-call coverage was inadequate. Significant
problems were also noted in the northeast (74 percent), the north
central (63 percent), and the western regions (72 percent).25
The inability to access an on-call specialist can have devastating
results. For example, 21 percent of patient deaths or permanent
injuries related to emergency department treatment delays are attributed
to lack of availability of physician specialists.26
The major reasons cited for the deterioration of on-call coverage for
emergency departments are declining reimbursement, medical liability
concerns, and an increasing number of specialists who practice only in
specialty hospitals or surgical centers.19 According to the
data collected for this Report Card, on average, states have access to
fewer than 2 neurosurgeons, fewer than 10 orthopedists or hand surgeons,
2 plastic surgeons, and slightly more than 3 ear, nose, and throat
specialists for every 100,000 people.27 However, it is
important to note that even in states that enjoy fairly high proportions
of specialists, such as Massachusetts, emergency departments still
struggle with inadequate supplies of those willing to be on call.
As the demand on emergency departments exceeds their capacity to
provide immediate care, one common response is to divert incoming
ambulances to another emergency department. The frequency of ambulance
diversion is a strong indicator of the stress on the entire emergency
care system. Unfortunately, statistics regarding ambulance diversion
are not collected in all 50 states. One recently published national
study estimated that more than a half million ambulances are diverted
every year – equal to an average of one every minute.28 For
this Report Card, ACEP surveyed state health officials about their data
collection and estimates regarding ambulance diversions. Twenty-five
states reported collecting data on diversions, and 20 provided data on
diversion frequency and duration in their state. Of those 20 states,
only 4 reported no diversions, while 9 reported having hospitals on
diversion an average of 1-4 percent of the time, 1 reported a time on
diversion average of 5-9 percent, 3 had hospitals on diversion an
average of 10-19 percent of the time, and 3 had a hospital diversion
average of 20 percent of the time or more.
Emergency department boarding and hospital crowding are also widely
felt across the country. According to the data analyzed for this Report
Card, the average state has 20 emergency departments per 1 million
people, but this figure ranges from a high of 66 per 1 million people to
a low of 7 per 1 million people.29 The average state’s daily
hospital occupancy rate is reported to be 67 per 100 staffed beds, but
that number goes as high as 85 per 100 in some states. Moreover, the
time of day when hospital patients are counted may vary, and may not
reflect times of peak occupancy. In addition, a lack of specialty beds
(e.g., ICU, burn unit, psychiatric) contributes to hospital crowding and
emergency department boarding as patients must wait hours or even days
to transfer to appropriate units or facilities.
Most states are experiencing a shortage of primary care physicians as
well. Based on data from the U.S. Health Resources and Services
Administration’s Bureau of Primary Care, the average state needs a total
of an additional 136 full-time equivalent primary care providers to
adequately care for its population, but some states need to fill more
than 700 full-time equivalent primary care provider positions to do so.
Similarly, there is a clear need for mental health specialists. The
average number of full-time equivalent mental health positions that need
to be filled is 30, though some states need more than 200 additional
mental health providers to adequately serve their populations.30
As a result, patients experience longer waits trying to obtain
appointments with primary care or mental health care providers. Delayed
appointments are more likely to increase demand for services in
emergency departments as medical conditions worsen and the need for
emergency care increases.
The financial challenges associated with decreasing reimbursement and
increasing numbers of uninsured patients also affect emergency service
access across the country. Declining reimbursement rates from public
programs such as Medicaid and Medicare and decreased and delayed
payments from private insurers add to these challenges by further
reducing patient access to primary care providers and increasing the
amount of uncompensated and undercompensated care demanded of emergency
departments.
Based on key indicators that were able to be measured and included in the Access to Emergency Care
category, the only A grade went to the District of Columbia, which
benefits from being an area with a high population density and high
rates of specialists, physicians accepting Medicare, staffed inpatient
beds, and Medicaid coverage. The next highest ranked states are Maine,
Massachusetts, Nebraska and West Virginia. The majority of states
struggle with this category, with almost half receiving a D or an F.
The states receiving a failing grade for access include (by rank in
ascending order) California, Florida, New Mexico, Arizona, Texas,
Nevada, South Carolina, Georgia, Washington, Idaho, Oregon, and
Oklahoma. Interestingly, while all of the failing grades occur in
southern or western states, no other single set of factors or negative
indicators distinguish them. They represent a mix of economic and
urban/rural environments. They face different combinations of challenges
in areas such as workforce shortages, lack of medical facilities, large
uninsured populations, low Medicaid reimbursement rates for office
visits, and short supplies of specialists.
Quality and Patient Safety Environment
It is important to note that this Report Card does not attempt to
measure the quality of emergency care provided by any physician or in
any particular facility in any given state, but focuses on key factors
related to the overall Quality and Patient Safety Environment that has been created in each state. Because many states have made it a priority to improve their Quality and Patient Safety Environments,
this is the category in which they receive the best scores. The
national grade for this category is a C+ and seven states receive an A
in this area, including Washington, Maryland, Utah, Pennsylvania, North
Carolina, Massachusetts, and Rhode Island. Five states also receive an
A- in this area. Though the exact combinations of factors vary across
these states, their high scores reflect an active investment in quality
reporting and improvement systems so that problems can be identified and
addressed and errors reduced. Increasingly, hospitals are implementing
electronic health records and computerized practitioner order entry to
increase consistency and safety. However, it is important to note that
the United States lags well behind other industrialized countries, where
the use of electronic medical systems is nearly universal.31
Three states receive failing grades in this category: South Dakota,
Arkansas, and Kentucky. The low grades generally reflect a lack of state
investment in enhanced quality systems or improvements for the EMS
system. They reveal weaknesses regarding the support for or
implementation of quality and patient safety improvement strategies that
involve cross-hospital systems or standards (e.g., cardiac care
networks, statewide trauma registries) to improve quality and prevent,
track, or reduce adverse events. The low grades also occur in states
that are less likely to have mandates in place to require quality
reporting or the tracking and reporting of negative outcomes such as
hospital-based infections and adverse events.

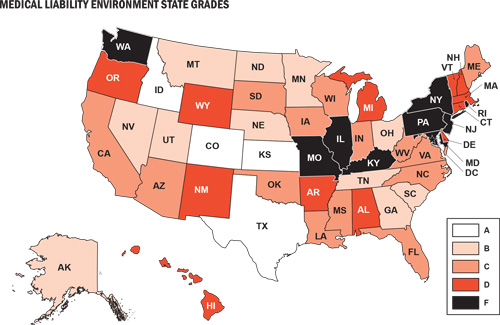
Medical Liability Environment
The role of medical liability in the United States is considerable, a
fact that is highlighted by comparisons with other countries. For
example, compared to the United Kingdom and Australia, the United States
has 50 percent more medical liability claims filed per 1,000 people and
a rate that is 350 percent higher than in Canada.32 In
two-thirds of the U.S. cases, the claims are dropped, dismissed, or
found in favor of the defendant. The rest are settled or judged in favor
of the claimant. In Britain and Canada, there is a single national
organization that protects physicians from liability litigation and the
premiums are subsidized by the government. The Australian government
also subsidizes premiums for physicians and reinsures high-cost claims.
In contrast, the United States lacks federal policies to subsidize
premiums or help protect physicians from litigation, including those
providing emergency or EMTALA-mandated care.
States report that the fear of liability claims and the costs of
medical liability insurance in the United States are driving more
physicians and medical students away from high-risk specialties or from
serving as on-call specialists to emergency departments. The consequence
is that patients have less access to needed services, potentially
compromising their care.
Research suggests that liability reforms can stabilize or reduce
medical liability premiums and limit fears of litigation on the part of
providers.33 State-by-state enactment of liability reforms has not succeeded in improving the overall picture of the Medical Liability Environment
in our nation. Full reform will require federal measures to protect and
support physicians who provide emergency and EMTALA-mandated care and
to even out the enormous discrepancies that currently exist across
states regarding the costs, risks, and rankings of their liability
environments.
The nation receives a C- in this category – barely mediocre –
despite successes in some states to enact and implement liability
reforms. The stars in this category are Colorado, Texas, Kansas,
Georgia, and South Carolina, which have passed liability reforms and
tend to have lower medical liability insurance premiums and malpractice
awards. There were nine failing grades in this category: the District of
Columbia, New Jersey, Rhode Island, Arizona, Kentucky, North Carolina,
Delaware, Vermont, and New York.
Public Health and Injury Prevention
Of all the categories of this Report Card, Public Health and Injury Prevention
is the one with the most indicators that can be measured against ideal
or international standards. In that light, the data are sobering.
Despite proven and economically efficient public health methods for
promoting health and reducing morbidity and mortality, the United States
does not measure well compared to accepted objectives or the outcomes
reached in other industrialized countries. For example, the infant
mortality rate across the United States is 6.9 deaths per 1,000 live
births, which is twice the rate of six other countries and places our
nation in 28th position behind such countries as Cuba, Canada, New
Zealand, Australia, Hong Kong, Singapore, Japan, and much of Europe.34
Infant mortality is a valuable indicator, because it reflects
disparities in the health status of women before and during pregnancy,
as well as the quality and accessibility of primary care for pregnant
women and infants.
Several measures can be easily compared to an ideal standard of 100
percent. For example, ideally, to further reduce traffic-related
mortality and morbidity, seat belt use by the occupants of front seats
would approach 100 percent. However, the average rate, according to data
collected for the Report Card, is 83 percent, with some states below 65
percent and a maximum of 98 percent. Similarly, childhood and adult
immunization rates would ideally approach 100 percent. However, the
proportion of children who have received all of the recommended vaccines
is only 80 percent.35 The proportion of adults aged 65 years
and over who have received an influenza vaccine in the past 12 months
is 69 percent, and the rate of those who have ever received a
pneumococcal vaccine is just 67 percent.36
The national grade for this category is a C, which in this case
reflects a balance between high and low performing states rather than a
cluster of average performances. The top four performers in this
category, Massachusetts, Utah, Connecticut, and Washington, receive a
grade of A, followed by Hawaii, which receives an A-. These states
receive high marks across multiple categories of prevention measures,
such as immunization rates, injury prevention funding, seat belt use, or
child safety seat and seat belt legislation. They also generally have
more positive outcomes in areas such as smoking or obesity rates, binge
drinking, traffic fatalities, and deaths from occupational, fire, or
firearm-related injuries.
The lowest ranked states in this category are Louisiana, South
Carolina, Mississippi, South Dakota, Arkansas, Montana, Wyoming, and
Alabama – all of which receive an F. Problems that tend to characterize
these states include low rates of seat belt use and high rates of
traffic fatalities. Poor immunization and high infant mortality along
with high rates of smoking, obesity, or alcohol-related traffic
fatalities are also common concerns. Lack of investment in injury
prevention and activities to promote greater access to and use of
preventive health measures are also reflected.

Disaster Preparedness
The overwhelming effects of Hurricane Katrina on the medical
infrastructure and emergency medical response capacity of an entire
region highlighted our nation’s vulnerability to major disasters.
However, federal funding in this area has been lacking. For example,
only 4 percent of funding from the Department of Homeland Security goes
to emergency medical system preparedness.37,38,15 As a
result, although numerous states have made considerable investments in
infrastructures and systems to respond to the health and emergency
medical needs that may arise as a result of a natural or manmade
catastrophe, the overall grade in this category is a C+.
The top ranked performers in this category include the District of
Columbia, Maryland, Louisiana, Pennsylvania, and North Dakota. All of
these states share some commonalities in this area, including having
received relatively high rates of federal funding per capita to support
disaster preparedness compared to other states. They have written
all-hazards medical response or ESF-8 plans, which are shared in most
cases with EMS and essential hospital personnel. Some have high bed
surge capacity and written plans to address special needs populations
and supply medications for chronic conditions in the event of a
disaster. They have relatively high rates of nurses and physicians
registered in a state-based Emergency System for Advanced Registration
of Volunteer Health Professionals. In addition, these states have
instituted communications and notification systems, and have held drills
and trainings for medical staff, emergency personnel, and essential
hospital personnel. The lowest ranked states for Disaster Preparedness
include Tennessee, Idaho, Alaska, Arkansas, and Nevada.

State Rankings and Variations
There are wide variations in state scores and rankings across each of
the different indicators. Every category includes states that receive
grades ranging from A to F, but no state receives either very high or
very low marks across all five of the categories. The highest overall
grade for a state is a B, a feat achieved by only one state:
Massachusetts. Even among the top performing states there are important
variations among categories. For example, although Massachusetts scores
an A in both Public Health and Injury Prevention and the Quality and Patient Safety Environment, it slips to a B in Disaster Preparedness and Access to Emergency Care and a D for the Medical Liability Environment. Similarly, fourth-ranked Maryland rates an A for both the Quality and Patient Safety Environment and Disaster Preparedness, but gets a C- in Access to Emergency Care and a D- in Medical Liability Environment.
The states with the lowest grades also show wide variations across
different indicator categories. Arkansas gets the lowest rank and an
overall grade of D-. However, while it has failing grades in three areas
(Public Health and Injury Prevention, Disaster Preparedness, and the Quality and Patient Safety Environment), it also gets a C+ for its Medical Liability Environment. Similarly, 49th-ranked New Mexico receives an F for Access to Emergency Care, but also a C- for its Quality and Patient Safety Environment.
Interestingly, there is a fair amount of heterogeneity among states
in the top and bottom ranks regarding wealth, geography, and rural or
frontier environments. For example, although most of the highest
performing states are located in the eastern United States, the list
also includes Nebraska, North Dakota, and Utah. Similarly, the lower
ranked states are located in several different regions, including the
West, Southwest, South, and Midwest.
Rural and Frontier Areas
The states with large rural or frontier areas, including low
population densities and large distances to medical facilities, face
greater challenges regarding health care access and health status
generally. Data confirm that people living in rural areas are more
likely than their urban or suburban counterparts to report being in poor
health, and are more likely to have higher rates of chronic diseases,
poor nutrition, cigarette smoking, and deaths from injuries. Rural
populations, on average, tend to be older than those in urban areas and
suffer from greater levels of poverty and unemployment. They are also
more likely to be geographically isolated and lack access to
transportation, a regular health provider, and health services.39
Many rural areas also face major shortages of health care providers.
For example, though 20 percent of America’s population lives in rural
areas, those areas are home to only 9 percent of the nation’s practicing
physicians,40 many of whom are older and increasingly aging out of the system.
On the other hand, rural emergency departments are less likely than
their urban counterparts to be crowded or have long wait times, and they
are more likely to have greater surge capacity. In many cases, the
challenges that rural and frontier areas face regarding access issues
are balanced with other indicators in this Report Card that reflect
state investments and strengths in such areas as the Quality and Patient Safety Environment, Public Health and Injury Prevention, and the Medical Liability Environment.
The states with the lowest scores overall include a majority
characterized by large rural or frontier areas, but there are
exceptions. For example, California and Florida are listed among the
bottom 10 for access, while North Dakota, Nebraska, and West Virginia
fall among the top 10. Similarly, while there is a greater
representation of wealthier states among the top 10 and of poorer states
among the bottom ranked group, the distinctions are not exclusive.
Overall Results: C-
The results of the 2009 Report Card present a picture of an emergency
care system fraught with significant challenges and under more stress
than ever before. The overall grade for the nation across all five categories is a C-. This low grade is particularly reflective of the poor score in Access to Emergency Care
(D-). Because of its direct impact on emergency services and capacity
for patient care, this category of indicators accounts for 30 percent of
the Report Card grade, so the poor score is especially relevant. This
category also incorporates many of the issues that states have
identified as their top areas of concern.24 These include:
- Boarding of patients in emergency departments and hospital crowding
- Lack of adequate access to on-call specialists
- Limited access to primary care services
- Shortages of emergency physicians and nurses
- Ambulance diversion
- Inadequate reimbursement from public and private insurers
- High rates of uninsured individuals
The grades for the other categories are slightly better, but not strong enough to pull up the full national average. Both Disaster Preparedness and Quality and Patient Safety Environment receive a C+, Public Health and Injury Prevention receives a grade of C, and the Medical Liability Environment receives a grade of C-.
| Top ranked states (highest to lowest) | Bottom ranked states (lowest to highest) |
| 1. Massachusetts 2. District of Columbia 2. Rhode Island 4. Maryland 5. Nebraska 6. Minnesota 7. Maine 8. Kansas 8. Pennsylvania 10. Delaware 10. North Dakota 10. Utah | 51. Arkansas 50. Oklahoma 49. New Mexico 48. Nevada 47. Oregon 46. Idaho 45. Arizona 44. Kentucky 43. Michigan 42. Wyoming |
National Trends and State Comparisons by Category
Access to Emergency Care
The national grade for Access to Emergency Care is a D-. As
noted earlier, the access category includes many of the issues that
states are struggling with the most. Unfortunately, there is a critical
lack of detailed and consistent state-specific data related to some of
these major access issues, such as boarding, ambulance diversion, and
on-call specialist shortages. Thus, though these issues are having a
serious impact on Access to Emergency Care across the country, it is virtually impossible to craft a meaningful state-by-state comparison of these indicators.
In a 2006 report, nearly three-quarters (73 percent) of emergency
department medical directors surveyed the previous year reported
inadequate on-call specialist coverage, compared with two-thirds in
2004. The problem was most pervasive in the southern United States, with
81 percent stating that on-call coverage was inadequate. Significant
problems were also noted in the northeast (74 percent), the north
central (63 percent), and the western regions (72 percent).25
The inability to access an on-call specialist can have devastating
results. For example, 21 percent of patient deaths or permanent
injuries related to emergency department treatment delays are attributed
to lack of availability of physician specialists.26
The major reasons cited for the deterioration of on-call coverage for
emergency departments are declining reimbursement, medical liability
concerns, and an increasing number of specialists who practice only in
specialty hospitals or surgical centers.19 According to the
data collected for this Report Card, on average, states have access to
fewer than 2 neurosurgeons, fewer than 10 orthopedists or hand surgeons,
2 plastic surgeons, and slightly more than 3 ear, nose, and throat
specialists for every 100,000 people.27 However, it is
important to note that even in states that enjoy fairly high proportions
of specialists, such as Massachusetts, emergency departments still
struggle with inadequate supplies of those willing to be on call.
As the demand on emergency departments exceeds their capacity to
provide immediate care, one common response is to divert incoming
ambulances to another emergency department. The frequency of ambulance
diversion is a strong indicator of the stress on the entire emergency
care system. Unfortunately, statistics regarding ambulance diversion
are not collected in all 50 states. One recently published national
study estimated that more than a half million ambulances are diverted
every year – equal to an average of one every minute.28 For
this Report Card, ACEP surveyed state health officials about their data
collection and estimates regarding ambulance diversions. Twenty-five
states reported collecting data on diversions, and 20 provided data on
diversion frequency and duration in their state. Of those 20 states,
only 4 reported no diversions, while 9 reported having hospitals on
diversion an average of 1-4 percent of the time, 1 reported a time on
diversion average of 5-9 percent, 3 had hospitals on diversion an
average of 10-19 percent of the time, and 3 had a hospital diversion
average of 20 percent of the time or more.
Emergency department boarding and hospital crowding are also widely
felt across the country. According to the data analyzed for this Report
Card, the average state has 20 emergency departments per 1 million
people, but this figure ranges from a high of 66 per 1 million people to
a low of 7 per 1 million people.29 The average state’s daily
hospital occupancy rate is reported to be 67 per 100 staffed beds, but
that number goes as high as 85 per 100 in some states. Moreover, the
time of day when hospital patients are counted may vary, and may not
reflect times of peak occupancy. In addition, a lack of specialty beds
(e.g., ICU, burn unit, psychiatric) contributes to hospital crowding and
emergency department boarding as patients must wait hours or even days
to transfer to appropriate units or facilities.
Most states are experiencing a shortage of primary care physicians as
well. Based on data from the U.S. Health Resources and Services
Administration’s Bureau of Primary Care, the average state needs a total
of an additional 136 full-time equivalent primary care providers to
adequately care for its population, but some states need to fill more
than 700 full-time equivalent primary care provider positions to do so.
Similarly, there is a clear need for mental health specialists. The
average number of full-time equivalent mental health positions that need
to be filled is 30, though some states need more than 200 additional
mental health providers to adequately serve their populations.30
As a result, patients experience longer waits trying to obtain
appointments with primary care or mental health care providers. Delayed
appointments are more likely to increase demand for services in
emergency departments as medical conditions worsen and the need for
emergency care increases.
The financial challenges associated with decreasing reimbursement and
increasing numbers of uninsured patients also affect emergency service
access across the country. Declining reimbursement rates from public
programs such as Medicaid and Medicare and decreased and delayed
payments from private insurers add to these challenges by further
reducing patient access to primary care providers and increasing the
amount of uncompensated and undercompensated care demanded of emergency
departments.
Based on key indicators that were able to be measured and included in the Access to Emergency Care
category, the only A grade went to the District of Columbia, which
benefits from being an area with a high population density and high
rates of specialists, physicians accepting Medicare, staffed inpatient
beds, and Medicaid coverage. The next highest ranked states are Maine,
Massachusetts, Nebraska and West Virginia. The majority of states
struggle with this category, with almost half receiving a D or an F.
The states receiving a failing grade for access include (by rank in
ascending order) California, Florida, New Mexico, Arizona, Texas,
Nevada, South Carolina, Georgia, Washington, Idaho, Oregon, and
Oklahoma. Interestingly, while all of the failing grades occur in
southern or western states, no other single set of factors or negative
indicators distinguish them. They represent a mix of economic and
urban/rural environments. They face different combinations of challenges
in areas such as workforce shortages, lack of medical facilities, large
uninsured populations, low Medicaid reimbursement rates for office
visits, and short supplies of specialists.
Quality and Patient Safety Environment
It is important to note that this Report Card does not attempt to
measure the quality of emergency care provided by any physician or in
any particular facility in any given state, but focuses on key factors
related to the overall Quality and Patient Safety Environment that has been created in each state. Because many states have made it a priority to improve their Quality and Patient Safety Environments,
this is the category in which they receive the best scores. The
national grade for this category is a C+ and seven states receive an A
in this area, including Washington, Maryland, Utah, Pennsylvania, North
Carolina, Massachusetts, and Rhode Island. Five states also receive an
A- in this area. Though the exact combinations of factors vary across
these states, their high scores reflect an active investment in quality
reporting and improvement systems so that problems can be identified and
addressed and errors reduced. Increasingly, hospitals are implementing
electronic health records and computerized practitioner order entry to
increase consistency and safety. However, it is important to note that
the United States lags well behind other industrialized countries, where
the use of electronic medical systems is nearly universal.31
Three states receive failing grades in this category: South Dakota,
Arkansas, and Kentucky. The low grades generally reflect a lack of state
investment in enhanced quality systems or improvements for the EMS
system. They reveal weaknesses regarding the support for or
implementation of quality and patient safety improvement strategies that
involve cross-hospital systems or standards (e.g., cardiac care
networks, statewide trauma registries) to improve quality and prevent,
track, or reduce adverse events. The low grades also occur in states
that are less likely to have mandates in place to require quality
reporting or the tracking and reporting of negative outcomes such as
hospital-based infections and adverse events.
Medical Liability Environment
The role of medical liability in the United States is considerable, a
fact that is highlighted by comparisons with other countries. For
example, compared to the United Kingdom and Australia, the United States
has 50 percent more medical liability claims filed per 1,000 people and
a rate that is 350 percent higher than in Canada.32 In
two-thirds of the U.S. cases, the claims are dropped, dismissed, or
found in favor of the defendant. The rest are settled or judged in favor
of the claimant. In Britain and Canada, there is a single national
organization that protects physicians from liability litigation and the
premiums are subsidized by the government. The Australian government
also subsidizes premiums for physicians and reinsures high-cost claims.
In contrast, the United States lacks federal policies to subsidize
premiums or help protect physicians from litigation, including those
providing emergency or EMTALA-mandated care.
States report that the fear of liability claims and the costs of
medical liability insurance in the United States are driving more
physicians and medical students away from high-risk specialties or from
serving as on-call specialists to emergency departments. The consequence
is that patients have less access to needed services, potentially
compromising their care.
Research suggests that liability reforms can stabilize or reduce
medical liability premiums and limit fears of litigation on the part of
providers.33 State-by-state enactment of liability reforms has not succeeded in improving the overall picture of the Medical Liability Environment
in our nation. Full reform will require federal measures to protect and
support physicians who provide emergency and EMTALA-mandated care and
to even out the enormous discrepancies that currently exist across
states regarding the costs, risks, and rankings of their liability
environments.
The nation receives a C- in this category – barely mediocre –
despite successes in some states to enact and implement liability
reforms. The stars in this category are Colorado, Texas, Kansas,
Georgia, and South Carolina, which have passed liability reforms and
tend to have lower medical liability insurance premiums and malpractice
awards. There were nine failing grades in this category: the District of
Columbia, New Jersey, Rhode Island, Arizona, Kentucky, North Carolina,
Delaware, Vermont, and New York.
Public Health and Injury Prevention
Of all the categories of this Report Card, Public Health and Injury Prevention
is the one with the most indicators that can be measured against ideal
or international standards. In that light, the data are sobering.
Despite proven and economically efficient public health methods for
promoting health and reducing morbidity and mortality, the United States
does not measure well compared to accepted objectives or the outcomes
reached in other industrialized countries. For example, the infant
mortality rate across the United States is 6.9 deaths per 1,000 live
births, which is twice the rate of six other countries and places our
nation in 28th position behind such countries as Cuba, Canada, New
Zealand, Australia, Hong Kong, Singapore, Japan, and much of Europe.34
Infant mortality is a valuable indicator, because it reflects
disparities in the health status of women before and during pregnancy,
as well as the quality and accessibility of primary care for pregnant
women and infants.
Several measures can be easily compared to an ideal standard of 100
percent. For example, ideally, to further reduce traffic-related
mortality and morbidity, seat belt use by the occupants of front seats
would approach 100 percent. However, the average rate, according to data
collected for the Report Card, is 83 percent, with some states below 65
percent and a maximum of 98 percent. Similarly, childhood and adult
immunization rates would ideally approach 100 percent. However, the
proportion of children who have received all of the recommended vaccines
is only 80 percent.35 The proportion of adults aged 65 years
and over who have received an influenza vaccine in the past 12 months
is 69 percent, and the rate of those who have ever received a
pneumococcal vaccine is just 67 percent.36
The national grade for this category is a C, which in this case
reflects a balance between high and low performing states rather than a
cluster of average performances. The top four performers in this
category, Massachusetts, Utah, Connecticut, and Washington, receive a
grade of A, followed by Hawaii, which receives an A-. These states
receive high marks across multiple categories of prevention measures,
such as immunization rates, injury prevention funding, seat belt use, or
child safety seat and seat belt legislation. They also generally have
more positive outcomes in areas such as smoking or obesity rates, binge
drinking, traffic fatalities, and deaths from occupational, fire, or
firearm-related injuries.
The lowest ranked states in this category are Louisiana, South
Carolina, Mississippi, South Dakota, Arkansas, Montana, Wyoming, and
Alabama – all of which receive an F. Problems that tend to characterize
these states include low rates of seat belt use and high rates of
traffic fatalities. Poor immunization and high infant mortality along
with high rates of smoking, obesity, or alcohol-related traffic
fatalities are also common concerns. Lack of investment in injury
prevention and activities to promote greater access to and use of
preventive health measures are also reflected.
Disaster Preparedness
The overwhelming effects of Hurricane Katrina on the medical
infrastructure and emergency medical response capacity of an entire
region highlighted our nation’s vulnerability to major disasters.
However, federal funding in this area has been lacking. For example,
only 4 percent of funding from the Department of Homeland Security goes
to emergency medical system preparedness.37,38,15 As a
result, although numerous states have made considerable investments in
infrastructures and systems to respond to the health and emergency
medical needs that may arise as a result of a natural or manmade
catastrophe, the overall grade in this category is a C+.
The top ranked performers in this category include the District of
Columbia, Maryland, Louisiana, Pennsylvania, and North Dakota. All of
these states share some commonalities in this area, including having
received relatively high rates of federal funding per capita to support
disaster preparedness compared to other states. They have written
all-hazards medical response or ESF-8 plans, which are shared in most
cases with EMS and essential hospital personnel. Some have high bed
surge capacity and written plans to address special needs populations
and supply medications for chronic conditions in the event of a
disaster. They have relatively high rates of nurses and physicians
registered in a state-based Emergency System for Advanced Registration
of Volunteer Health Professionals. In addition, these states have
instituted communications and notification systems, and have held drills
and trainings for medical staff, emergency personnel, and essential
hospital personnel. The lowest ranked states for Disaster Preparedness
include Tennessee, Idaho, Alaska, Arkansas, and Nevada.
State Rankings and Variations
There are wide variations in state scores and rankings across each of
the different indicators. Every category includes states that receive
grades ranging from A to F, but no state receives either very high or
very low marks across all five of the categories. The highest overall
grade for a state is a B, a feat achieved by only one state:
Massachusetts. Even among the top performing states there are important
variations among categories. For example, although Massachusetts scores
an A in both Public Health and Injury Prevention and the Quality and Patient Safety Environment, it slips to a B in Disaster Preparedness and Access to Emergency Care and a D for the Medical Liability Environment. Similarly, fourth-ranked Maryland rates an A for both the Quality and Patient Safety Environment and Disaster Preparedness, but gets a C- in Access to Emergency Care and a D- in Medical Liability Environment.
The states with the lowest grades also show wide variations across
different indicator categories. Arkansas gets the lowest rank and an
overall grade of D-. However, while it has failing grades in three areas
(Public Health and Injury Prevention, Disaster Preparedness, and the Quality and Patient Safety Environment), it also gets a C+ for its Medical Liability Environment. Similarly, 49th-ranked New Mexico receives an F for Access to Emergency Care, but also a C- for its Quality and Patient Safety Environment.
Interestingly, there is a fair amount of heterogeneity among states
in the top and bottom ranks regarding wealth, geography, and rural or
frontier environments. For example, although most of the highest
performing states are located in the eastern United States, the list
also includes Nebraska, North Dakota, and Utah. Similarly, the lower
ranked states are located in several different regions, including the
West, Southwest, South, and Midwest.
Rural and Frontier Areas
The states with large rural or frontier areas, including low
population densities and large distances to medical facilities, face
greater challenges regarding health care access and health status
generally. Data confirm that people living in rural areas are more
likely than their urban or suburban counterparts to report being in poor
health, and are more likely to have higher rates of chronic diseases,
poor nutrition, cigarette smoking, and deaths from injuries. Rural
populations, on average, tend to be older than those in urban areas and
suffer from greater levels of poverty and unemployment. They are also
more likely to be geographically isolated and lack access to
transportation, a regular health provider, and health services.39
Many rural areas also face major shortages of health care providers.
For example, though 20 percent of America’s population lives in rural
areas, those areas are home to only 9 percent of the nation’s practicing
physicians,40 many of whom are older and increasingly aging out of the system.
On the other hand, rural emergency departments are less likely than
their urban counterparts to be crowded or have long wait times, and they
are more likely to have greater surge capacity. In many cases, the
challenges that rural and frontier areas face regarding access issues
are balanced with other indicators in this Report Card that reflect
state investments and strengths in such areas as the Quality and Patient Safety Environment, Public Health and Injury Prevention, and the Medical Liability Environment.
The states with the lowest scores overall include a majority
characterized by large rural or frontier areas, but there are
exceptions. For example, California and Florida are listed among the
bottom 10 for access, while North Dakota, Nebraska, and West Virginia
fall among the top 10. Similarly, while there is a greater
representation of wealthier states among the top 10 and of poorer states
among the bottom ranked group, the distinctions are not exclusive.
- Join date : 1969-12-31
» Best and worst states for healthcare
» Updated States Healthcare Rankings
» Good and Bad States For Travelers
» Prison States - States Where You Are Most Likely To Wind Up In Prison
» Government Healthcare, YOU decide!
» Updated States Healthcare Rankings
» Good and Bad States For Travelers
» Prison States - States Where You Are Most Likely To Wind Up In Prison
» Government Healthcare, YOU decide!
Page 1 of 1
Permissions in this forum:
You cannot reply to topics in this forum|
|
|
